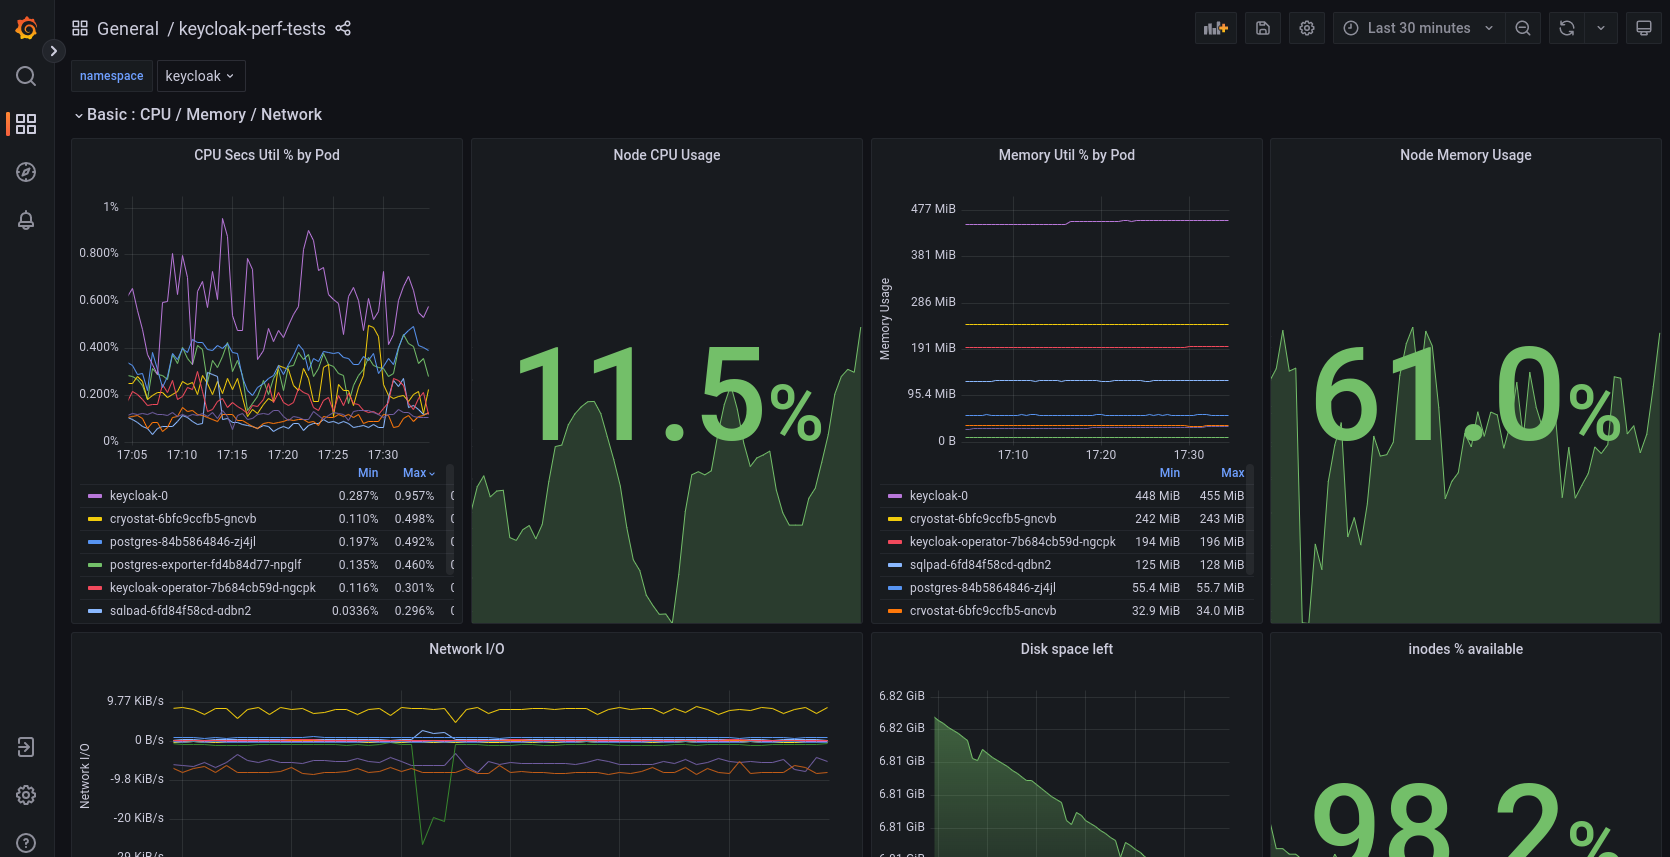
Visualizing metrics with Grafana
A user can access metrics on pre-built Dashboards in Grafana and use them for ad hoc reporting.
|
This setup is specific to the Keycloak Benchmark Project. There is additional information available on how to use Grafana dashboards with Keycloak in the Observability guide on dashboards. |
Opening Grafana
Grafana is deployed by default.
Assuming the command minikube ip returned 192.168.39.39, the console is available on http://grafana.192.168.39.39.nip.io.
| minikube’s IP address changes every time the minikube instance is re-created. |
Adding custom dashboards
Login to Grafana with the username admin and the password keycloak or the password relevant to your deployment when anonymous login is not sufficient.
Custom dashboards are included in folder monitoring/dashboards.
Add more dashboards there as new files, and task installs the latest versions in the minikube cluster.
Taking dashboard snapshots
Once logged in to Grafana with the username admin and the password relevant to the deployment, the user would have the ability to take snapshots of the dashboards and export the snapshots as a json file to be able to import them into a standalone Grafana instance to view and interact with the dashboard.
You can read on more on how to take the snapshot and other ways to share a dashboard here.
Automated dashboard PDF downloads
We have a python script snapGrafana.py which allows us to take the PDF snapshots of the available dashboards for a given time window, Grafana instance, Kubernetes namespace.
Installing needed python libraries
pip3 install -U -r requirements.txtAnd we can check if all the requirements are satisfied using the below command.
python3 -m pip check
The playwright python module that’s imported needs additional installation using the command playwright install if not we would see a exception similar to this.
|
if you see a missing playwright._impl._api_types.Error: Executable doesn't exist at exception, just run the below command to download the needed browsers for the script to work.Usage
Once the requirements for the script are satisfied, you can use it with the below command and the dashboard pdf’s are downloaded to the current directory where you are executing this script from.
python3 snapGrafana.py --grafana_domain ${GRAFANA_DOMAIN} \
--admin_password ${KEYCLOAK_MASTER_PASSWORD} \
--time_window "from=1694801561166&to=1694802033424" \
--keycloak_namespace "runner-keycloak"
snapGrafana.py cli options
| CLI option | Default | Notes |
|---|---|---|
|
(not set) |
The domain of the Grafana server without the example: |
|
(not set) |
This is the Grafana Admin user password, if you use minikube deployment its |
|
runner-keycloak |
The namespace in which the target Keycloak is deployed, this is used by the grafana dashboards to filter. |
|
(not set) |
The time window used by the dashboard to filter the scope of the dashboard. When using the Ansible module’s When using |