Capturing performance metrics with Cryostat
A user can collect performance metrics about memory allocation and CPU usage with Cryostat.
About Cryostat
Cryostat is Java Flight Recorder handling for Containerized Java Applications.
Visit the Cryostat website for more information.
| This is not using async profiling as this is not available inside OpenShift AFAIK. Therefore, the recordings will have the Safepoint bias problem. See Profiling Java in a container. |
Opening Cryostat
Creating a Java Flight Recorder recording
-
Open the Cryostat instance’s website.
-
Click on the menu item Recordings.
-
Select a target VM.
-
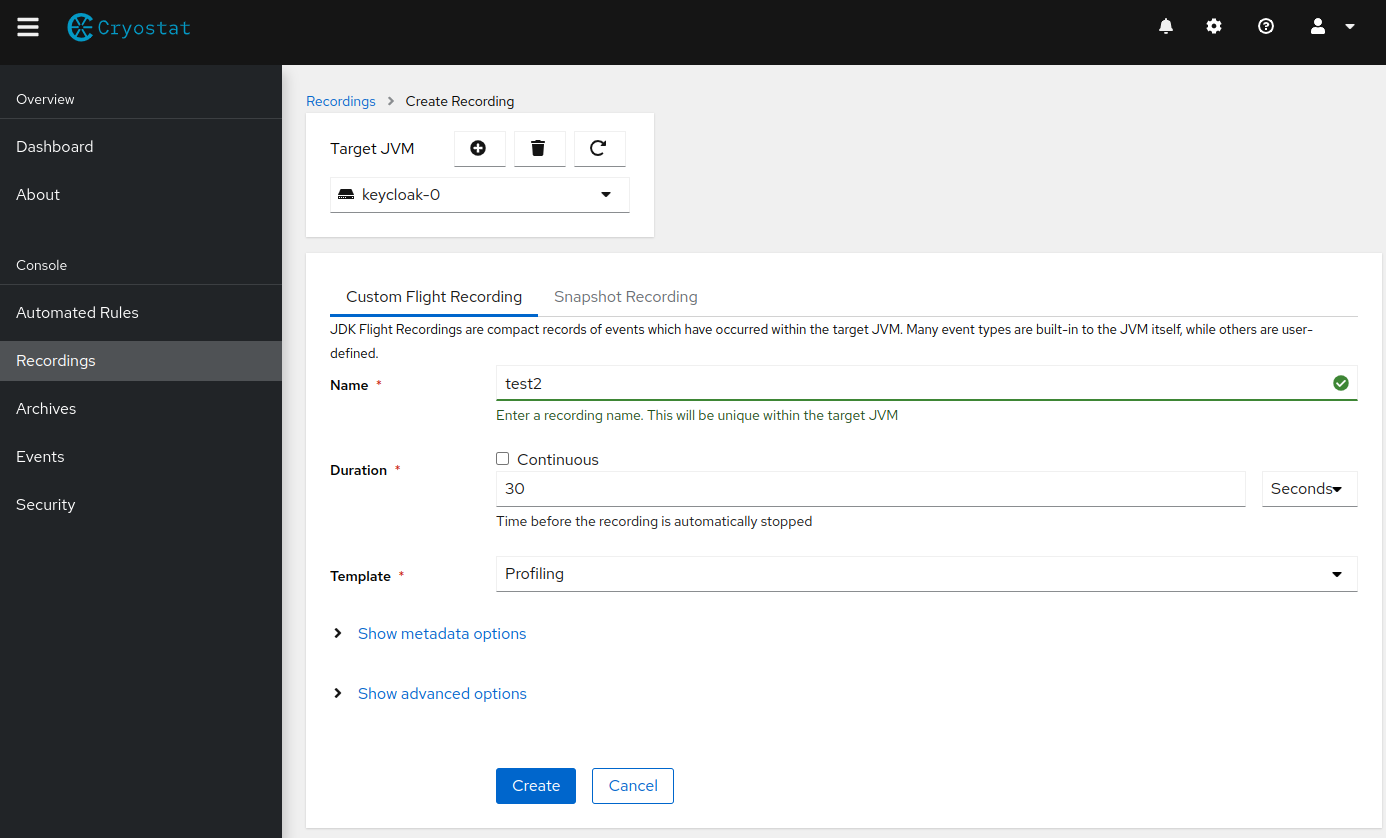
Click on button Create to create a new recording and follow the dialogs.
-
As the template, choose Profiling to capture CPU and memory profiling information.
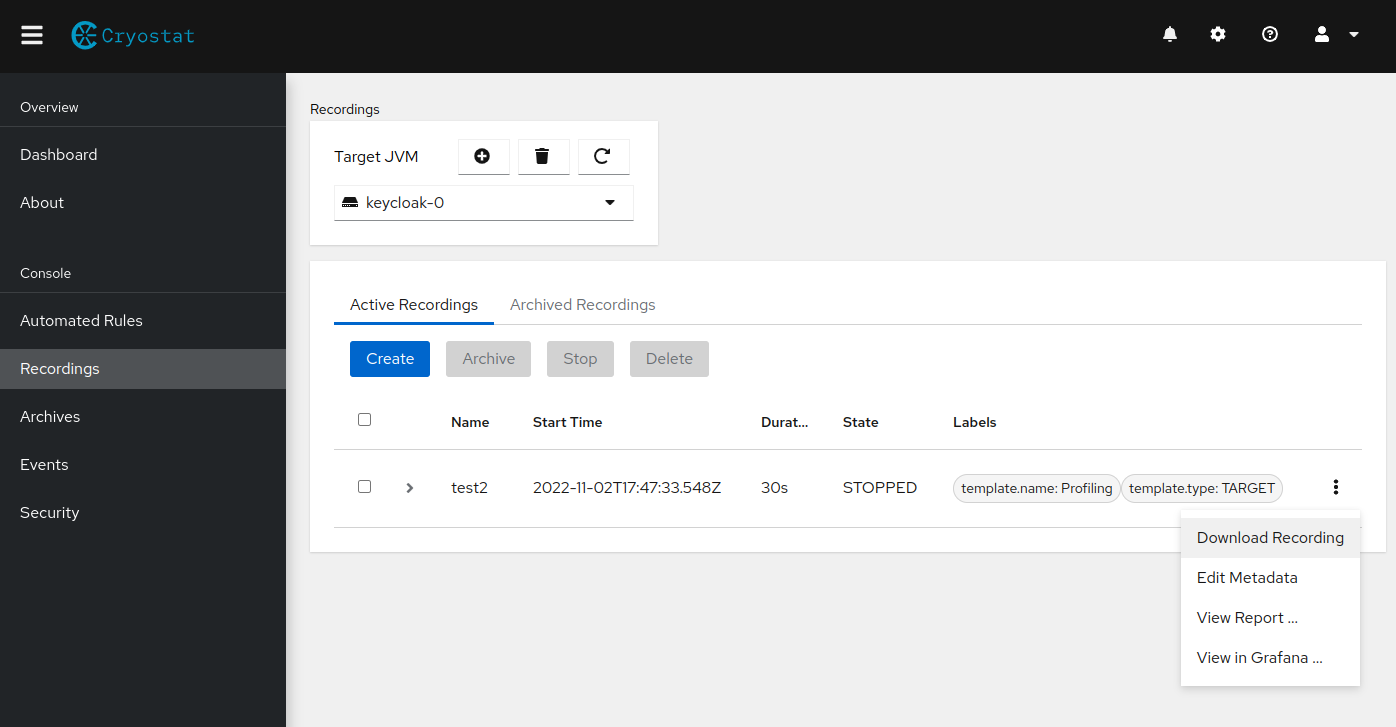
Downloading a recording
Once the recording is complete, download it directly or archive it to the persistent volume of Cryostat to download it later.
Accessing Grafana
When running minikube, there are no extra credentials necessary to access Grafana. When running on OpenShift, the Cryostat docs contain the details on how to retrieve the password.
Analyzing a Java Flight Recorder recording
Open the recording in IntelliJ Ultimate (the community edition isn’t sufficient), or use Java Mission Control (JMC) version 8.
When opening it in IntelliJ Ultimate, choose the Profiler tool window, and press the button Open Snapshot. Choose either the tab Flame Graph or Method List. In the upper right corner the user can switch between CPU and memory profiling results.
When opening it in JMC, select the menu item Method Profiling or Memory. Unfortunately, the flame view seems to be broken in version 8.2.1 on Fedora; it is simply blank. Still, the list of methods provides some value.