Debugging Keycloak
Analyze problems during development by connecting a debugger on the local machine to Keycloak inside minikube. A running version of Keycloak within minikube is a prerequisite.
Overview
The deployment of Keycloak has debugging enabled by default and opens node port 30012 on minikube.
Developers use their local IDE to connect to the Keycloak instance running in minikube using a JVM remote debugging session.
All ports are specified without the port offset.
If you are using the configuration option KC_PORT_OFFSET you need to add the offset to port numbers.
For the port offset XX (00-26) and the port number 300YY the resulting port will be 3XXYY.
|
How to set it up
Prerequisite:
-
Java IDE on the local machine with either a checked-out Keycloak repository matching the deployed version of Keycloak to debug Keycloak, or a checked-out repository of a provider installed into Keycloak that the developer wants to debug.
Setup of remote debugging:
-
Determine the IP address of minikube by calling
minikube ipon a command line. -
Set up remote debugging with the host name using the IP address retrieved in the previous step and port number
30012.
| minikube’s IP address changes every time the minikube instance is re-created. |
All ports are specified without the port offset.
If you are using the configuration option KC_PORT_OFFSET you need to add the offset to port numbers.
For the port offset XX (00-26) and the port number 300YY the resulting port will be 3XXYY.
|
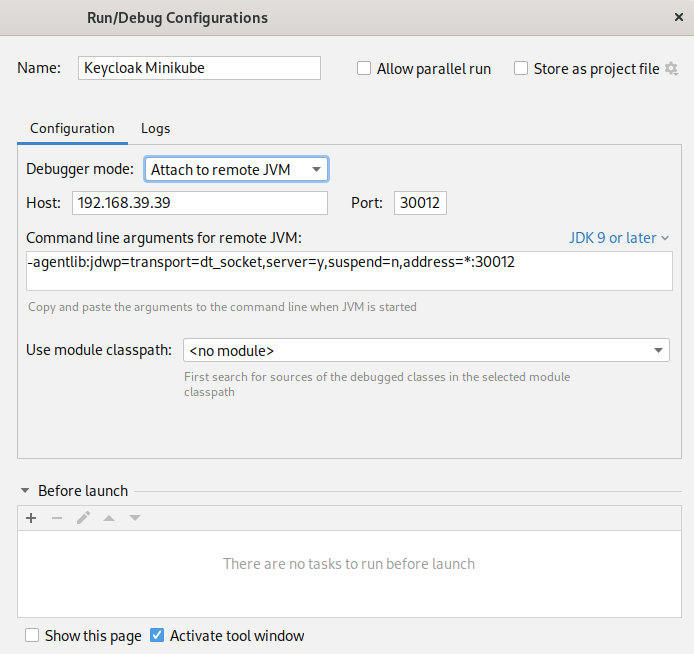
Assuming the command minikube ip returned 192.168.39.39, see an example screenshot from IntelliJ below.

Read more about remote debugging in IntelliJ.
Caveats when remote debugging Keycloak
-
When running multiple replicas of Keycloak in minikube, the IDE connects to a random instance.
-
When the Keycloak instance restarts (for example, due to a re-deployment), the IDE is disconnected automatically and the developer needs to re-start the debugging session.
-
When creating breakpoints that suspend all threads, this would also suspend the threads that serve the Kubernetes liveness probes. The probes eventually time out, and Kubernetes restarts the Keycloak pod unexpectedly during the debugging session.
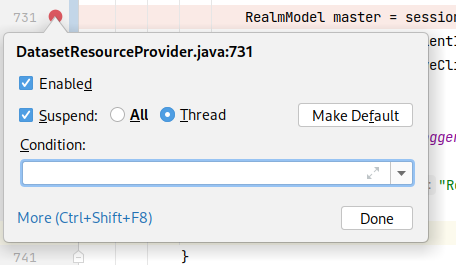
Instead, create breakpoints that only suspend the current thread. In IntelliJ, do this by:
-
Right-click on the breakpoint.
-
Adjust it for the current breakpoint.
-
Then make it the default for all future breakpoints.

-