Installing Keycloak on OpenShift
Deploy Keycloak on OpenShift with a setup similar to the minikube environment.
While minikube is the primary target for this setup, this tracks the progress on how to use it with an OpenShift environment, see Supported functionality.
Access to OpenShift with the cluster-admin role is required to be able to install custom resource definitions.
| OpenShift must not be accessible from the Internet, as this setup opens node ports and URLs that are not properly secured by good passwords and transport encryption. |
Supported functionality
At the moment, the following is known not to work on OpenShift:
- monitoring
-
The OpenShift only provides Grafana, OpenTelemetry and Jaeger for monitoring. Graphite is not implemented yet.
Cryostat depends on the Cryostat Operator to be installed, which is the default for the installation scripts provided by Installing OpenShift on AWS.
Installing Keycloak on OpenShift
-
Check out the Git repository from https://github.com/keycloak/keycloak-benchmark/.
-
Change to the folder
provision/openshift. -
Run the
taskcommand to provision all containers on OpenShift.
To configure the deployment, see Customizing the deployment for details.
Installing Keycloak from the Operator Hub
By default the operator is installed directly via keycloak-k8s-resources.
To install the operator from the Operator Hub using the Operator Lifecycle Manager set:
KC_OPERATOR_OLM=trueAdditionally it is possible to customize the following parameters:
- KC_OPERATOR_CATALOG_SOURCE_NS
-
Namespace of the OLM catalog source. Defaults to
openshift-marketplace. - KC_OPERATOR_CATALOG_SOURCE
-
OLM catalog source. Defaults to
community-operators. - KC_OPERATOR_NAME
-
Name of the Keycloak Operator in the catalog source. Defaults to
keycloak-operator. - KC_OPERATOR_CHANNEL
-
OLM subscription channel. If not set the default channel of the selected operator will be used.
- KC_OPERATOR_VERSION
-
Keycloak Operator version. If not set the current version from the selected channel will be used.
Note that the actual Cluster Service Version used for OLM subscription is set by convention as:
${KC_OPERATOR_NAME}.v${KC_OPERATOR_VERSION}
Installation Grafana monitoring
To install Grafana with a pre-configured dashboard, perform the following step:
-
Run the
task monitoringcommand
Verifying the installation
The Grafana dashboard is then available on:
https://grafana.apps.<domain name>| This is a shared resource for all users using the OpenShift cluster. While the next section describes how to install multiple Keycloaks in different namespaces, this doesn’t apply to the Grafana instance. |
OpenShift Logging
OpenShift logging is enabled by default.
All application and infrastructure pod logs are stored in a non-replicated ElasticSearch instance in the openshift-logging namespace.
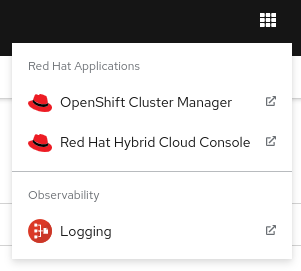
Logs can be queried in the Kibana UI, which can be accessed via the Application Launcher
 → Logging in the Openshift UI:

In addition, when looking at the logs of a pod, use the Show in Kibana link to search the logs for this specific pod:

On initial login to Kibana create an index pattern * with the timestamp field @timestamp to be able to query logs.
See the OpenShift docs for more details.
Sharing one OpenShift cluster with other users
The following options are necessary for customizing Keycloak deployment in a way that it can be used concurrently by multiple users within one OpenShift cluster.
KC_NAMESPACE_PREFIX-
Allows customizing the namespace name. The resulting namespace will be
${KC_NAMESPACE_PREFIX}keycloak. By default, the namespace prefix is set to$(whoami)-, but it can be customized in.envfile.