git clone -b BRANCH_FROM_STEP_1 https://github.com/keycloak/keycloak-grafana-dashboard.git
Nightly release
This guide is for the unstable nightly release, for the latest release go here.Visualizing activities in dashboards
Install the Keycloak Grafana dashboards to visualize the metrics that capture the status and activities of your deployment.Keycloak provides metrics to observe what is happening inside the deployment. To understand how metrics evolve over time, it is helpful to collect and visualize them in graphs.
This guide provides instructions on how to visualize collected Keycloak metrics in a running Grafana instance.
Prerequisites
-
Keycloak metrics are enabled. Follow Gaining insights with metrics guide for more details.
-
Grafana instance is running and Keycloak metrics are collected into a Prometheus instance.
-
For the HTTP request latency heatmaps to work, enable histograms for HTTP metrics by setting
http-metrics-histograms-enabledtotrue.
Keycloak Grafana dashboards
Grafana dashboards are distributed in the form of a JSON file that is imported into a Grafana instance. JSON definitions of Keycloak Grafana dashboards are available in the keycloak/keycloak-grafana-dashboard GitHub repository.
Follow these steps to download JSON file definitions.
-
Identify the branch from
keycloak-grafana-dashboardsto use from the following table.Keycloak version keycloak-grafana-dashboardsbranch/tag26.1 - 26.2
26.2.0>= 26.3
main -
Clone the GitHub repository
-
The dashboards are available in the directory
keycloak-grafana-dashboard/dashboards.
The following sections describe the purpose of each dashboard.
Keycloak troubleshooting dashboard
This dashboard is available in the JSON file: keycloak-troubleshooting-dashboard.json.
On the top of the dashboard, graphs display the service level indicators as defined in Monitoring performance with Service Level Indicators. This dashboard can be also used while troubleshooting a Keycloak deployment following the Troubleshooting using metrics guide, for example, when SLI graphs do not show expected results.
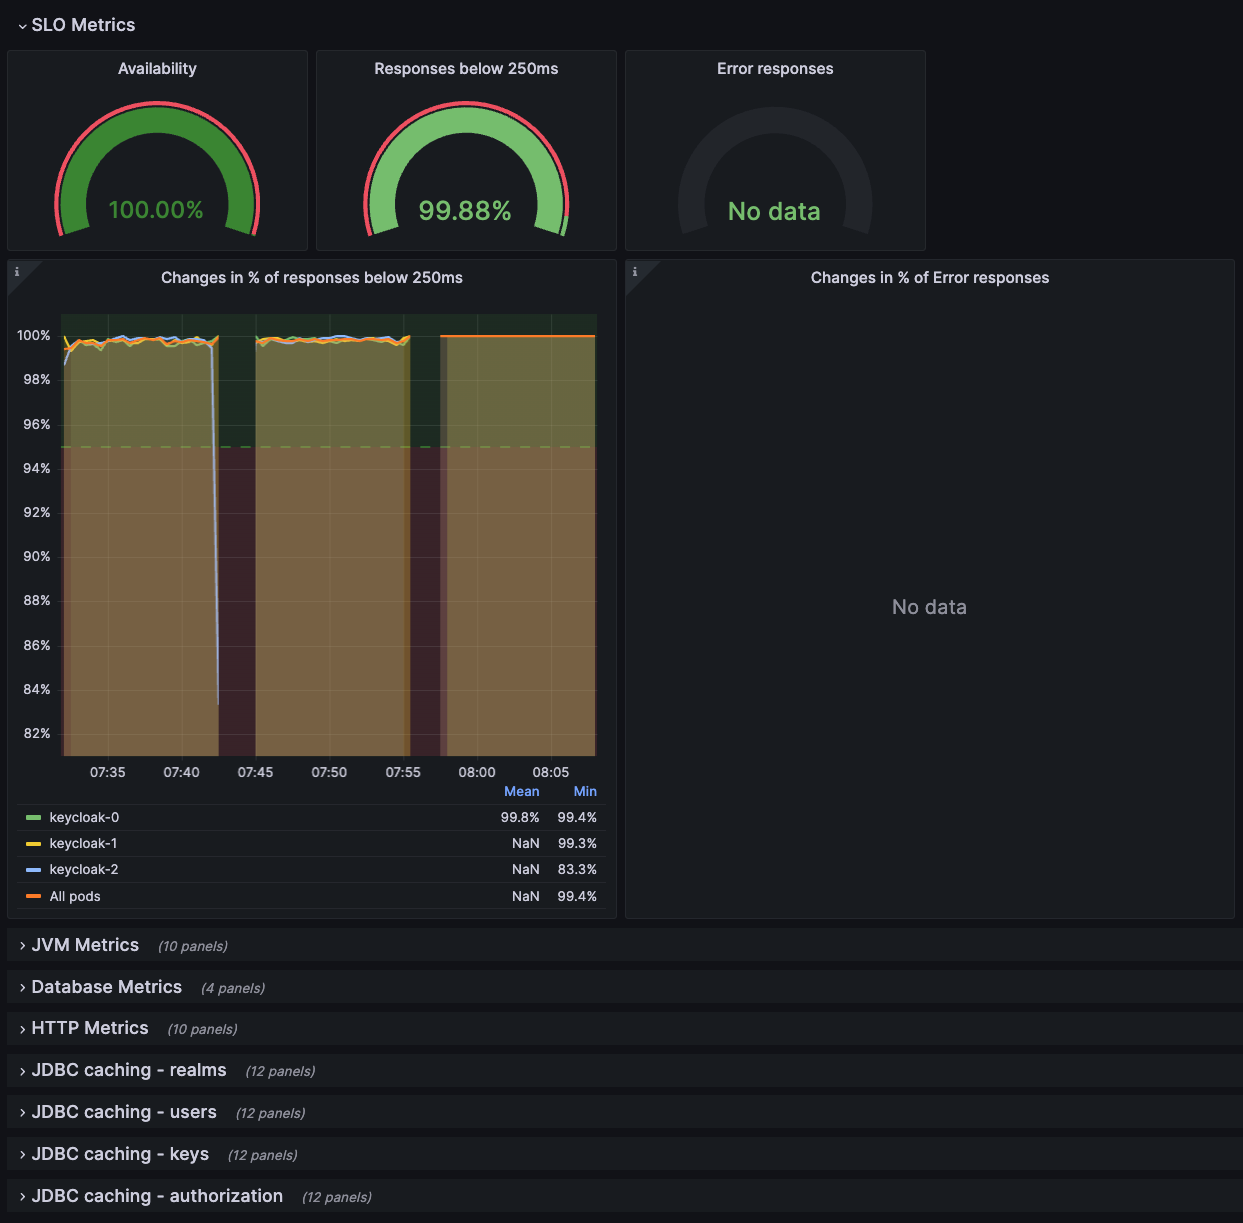
Figure 1. Troubleshooting dashboard
Keycloak capacity planning dashboard
This dashboard is available in the JSON file: keycloak-capacity-planning-dashboard.json.
This dashboard shows metrics that are important when estimating the load handled by a Keycloak deployment. For example, it shows the number of password validations or login flows performed by Keycloak. For more detail on these metrics, see the guide Self-provided metrics.
| Keycloak event metrics must be enabled for this dashboard to work correctly. To enable them, see the guide Monitoring user activities with event metrics. |
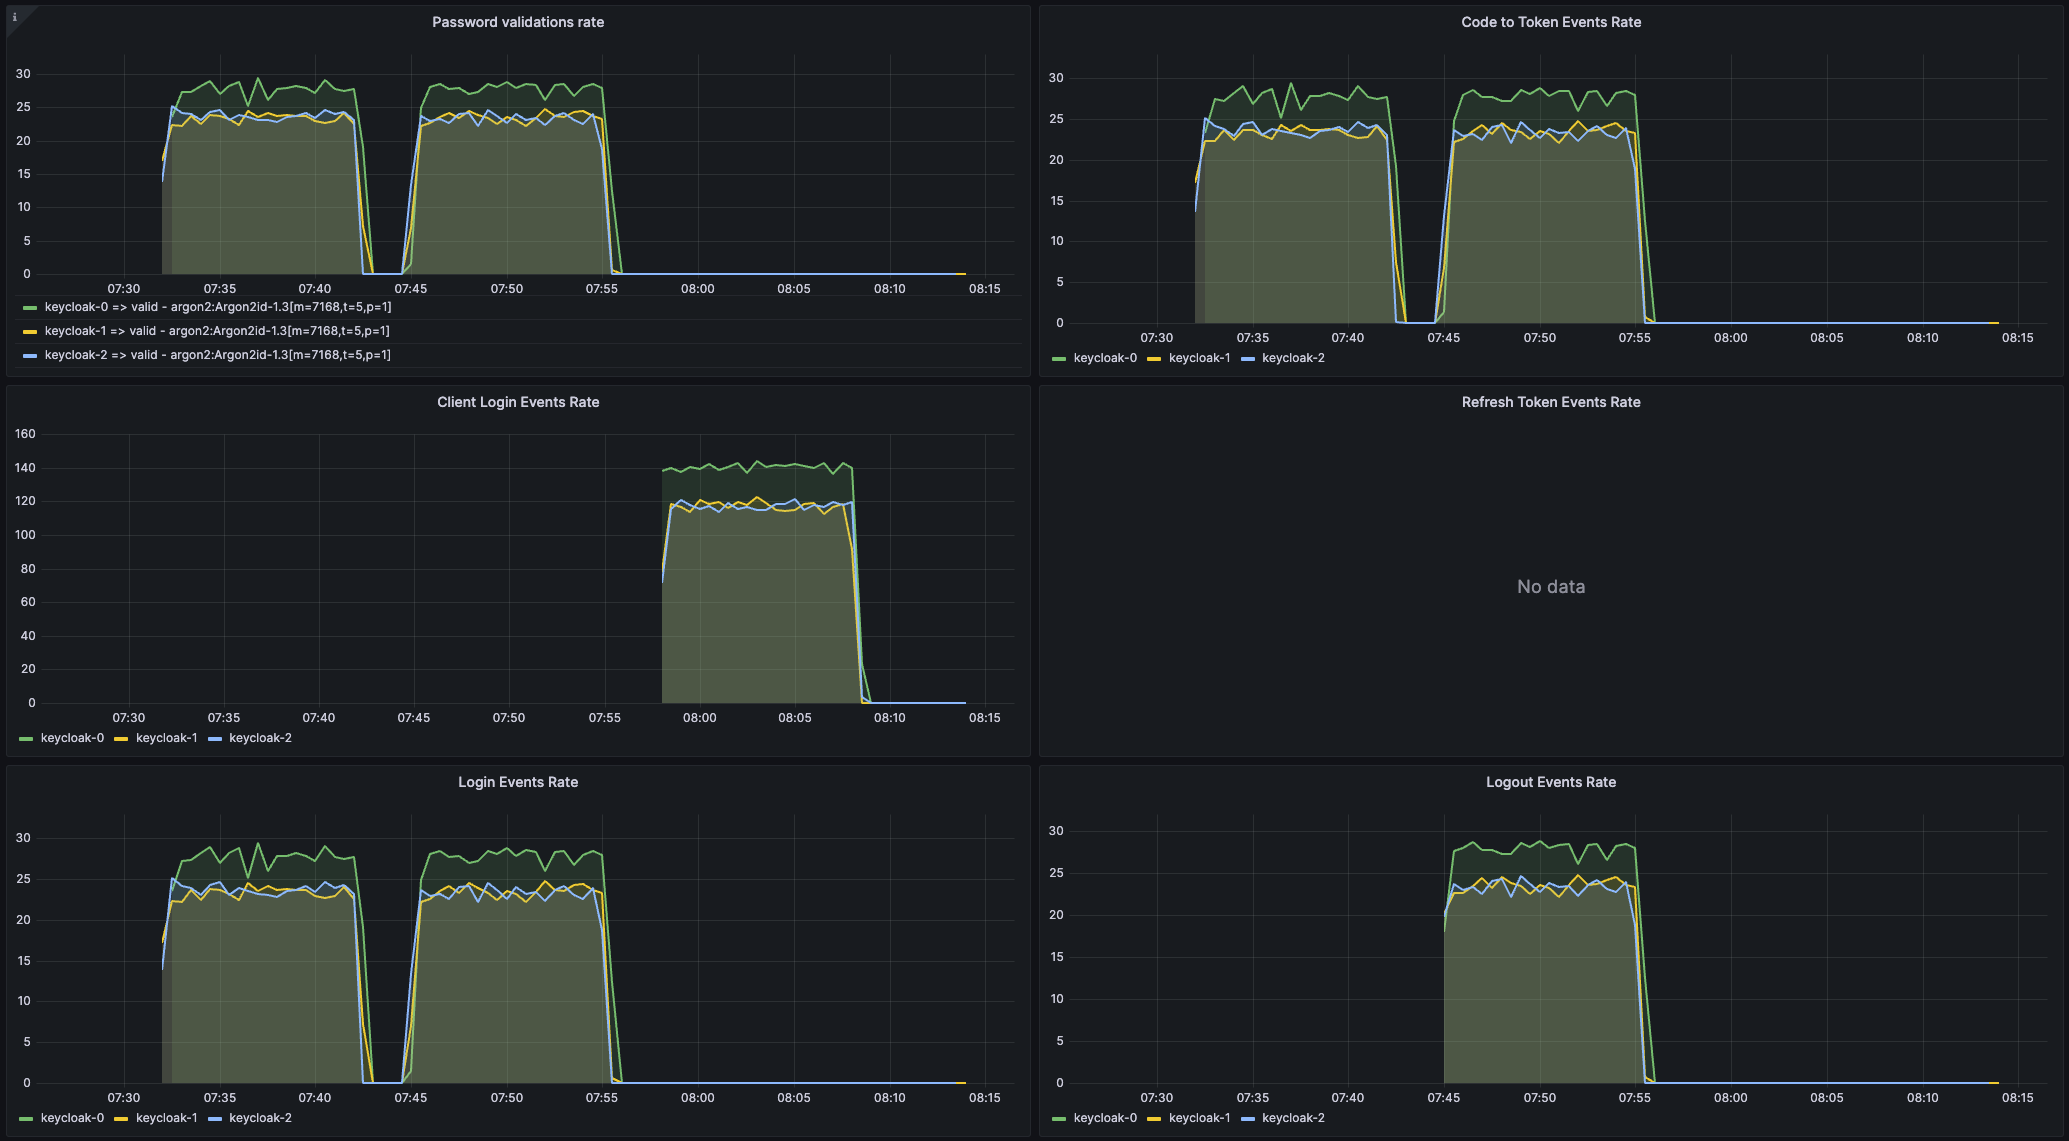
Figure 2. Capacity planning dashboard
Import a dashboard
-
Open the dashboard page from the left Grafana menu.
-
Click New and Import.
-
Click Upload dashboard JSON file and select the JSON file of the dashboard you want to import.
-
Pick your Prometheus datasource.
-
Click Import.
|
The Grafana dashboards have labels inserted by Kubernetes. It is possible to use the dashboards with bare-metal deployments by adding the missing labels in the Prometheus configuration file, as shown below. Prometheus Scrape Configuration
|
Export a dashboard
Exporting a dashboard to JSON format may be useful. For example, you may want to suggest a change in our dashboard repository.
-
Open a dashboard you would like to export.
-
Click share (
 ) in the top left corner next to the dashboard name.
 -
Click the Export tab.
-
Enable Export for sharing externally.
-
Click either Save to file or View JSON and Copy to Clipboard according to where you want to store the resulting JSON.
Further reading
Continue reading on how to connect traces to dashboard in the Analyzing outliers and errors with exemplars guide.
On this page