Nightly release
This guide is for the unstable nightly release, for the latest release go here.Analyzing outliers and errors with exemplars
Use exemplars to connect a metric to a recorded trace to analyze the root cause of errors or latencies.Metrics are aggregations over several events, and show you if your system is operating within defined bounds. They are great to monitor error rates or tail latencies and to set up alerting or drive performance optimizations. Still, the aggregation makes it difficult to find root causes for latencies or errors reported in metrics.
Root causes for errors and latencies can be found by enabling tracing. To connect a metric to a recorded trace, there is the concept of exemplars.
Once exemplars are set up, Keycloak reports metrics with their last recorded trace as an exemplar. A dashboard tool like Grafana can link the exemplar from a metrics dashboard to a trace view.
Metrics that support exemplars are:
-
http_server_requests_seconds_count(including histograms)
See the guide HTTP metrics for details on this metric. -
keycloak_credentials_password_hashing_validations_total
See the guide Self-provided metrics for details on this metric. -
keycloak_user_events_total
See the guide Self-provided metrics for details on this metric.
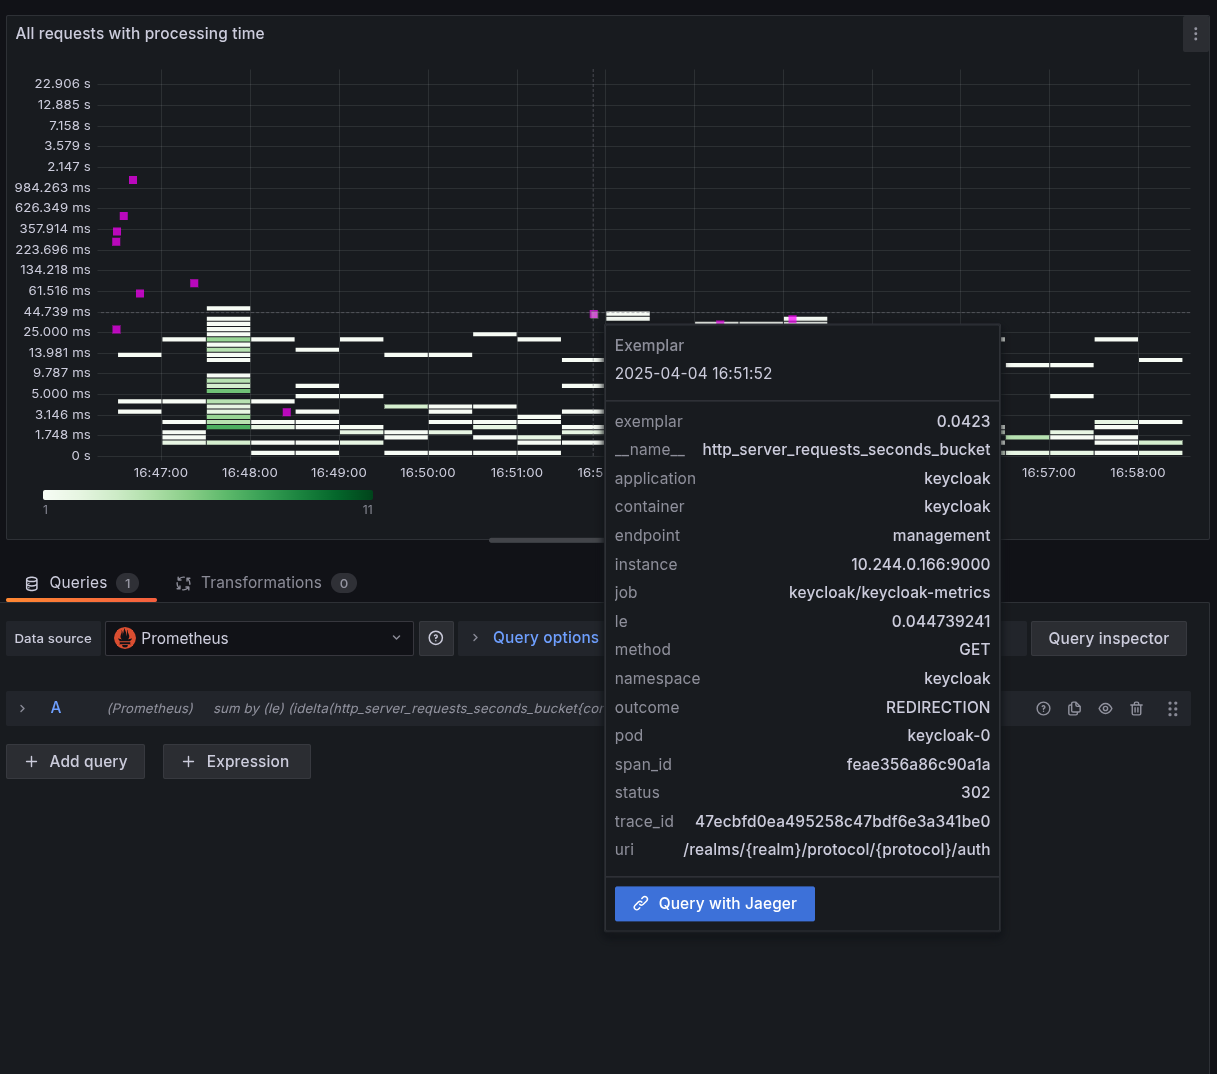
See below for a screenshot of a heatmap visualization for latencies that is showing an exemplar when hovering over one of the pink indicators.
Figure 1. Heatmap diagram with exemplar
Setting up exemplars
To benefit from exemplars, perform the following steps:
-
Enable metrics for Keycloak as described in guide Gaining insights with metrics.
-
Enable tracing for Keycloak as described in guide Root cause analysis with tracing.
-
Enable exemplar storage in your monitoring system.
For Prometheus, this is a preview feature that you need to enable.
-
Scrape the metrics using the
OpenMetricsText1.0.0protocol, which is not enabled by default in Prometheus.If you are using a
ServiceMonitoror similar in a Kubernetes environment, this can be achieved by adding it to the spec of the custom resource:apiVersion: monitoring.coreos.com/v1 kind: ServiceMonitor metadata: ... spec: scrapeProtocols: - OpenMetricsText1.0.0 -
Configure your metrics datasource where to link to for traces.
When using Grafana and Prometheus, this would be setting up a
exemplarTraceIdDestinationsfor the Prometheus datasource, which then points to your tracing datasource that is provided by tools like Jaeger or Tempo. -
Enable exemplars in your dashboards.
Enable the Exemplars toggle in each query on each dashboard where you want to show exemplars. When set up correctly, you will notice little dots or stars in your dashboards that you can click on to view the traces.
|
Verifying that exemplars work as expected
Perform the following steps to verify that Keycloak is set up correctly for exemplars:
-
Follow the instructions to set up metrics and tracing for Keycloak.
-
For test purposes, record all traces by setting the tracing ration to
1.0. See Root cause analysis with tracing for recommended sampling settings in production systems. -
Log in to the Keycloak instance to create some traces.
-
Scrape the metrics with a command similar to the following and search for those metrics that have an exemplar set:
$ curl -s http://localhost:9000/metrics \
-H 'Accept: application/openmetrics-text; version=1.0.0; charset=utf-8' \
| grep "#.*trace_id"
This should result in an output similar to the following. Note the additional
#after which the span and trace IDs are added:http_server_requests_seconds_count {...} ... # {span_id="...",trace_id="..."} ...
On this page