Observability in Keycloak 26.2
April 24 2025 by Michal Hajas
When running a central single sign on service like Keycloak in production, you need to understand how well the system performs and whether there are service degradations. Having a proper monitoring stack in place is essential for this. Moreover, when the system performance degrades, it is crucial to identify which part of the system is causing the problem to address it.
In the latest Keycloak release, all the above became more straightforward and works without additional extensions.
Read on to learn more and join our online session on May 7th to ask live questions!
Hey Keycloak! How are you?
Users rely on Keycloak to log in to their applications, and service level indicators (SLIs) capture the key metrics capturing that behavior. Misbehavior of the system can be detected by monitoring these SLIs.
One of the indicators can be the availability of the system. The indicator for availability can be defined as: percentage of the time the system can answer requests. The lower the indicator is for your system, the less available it was in the observed period.
Find an example set of SLIs for Keycloak and more details on this topic in the Monitoring performance with Service Level Indicators guide.
Oh no! You are not doing well?
Now we know how to detect when Keycloak is not performing well. But what should I do when a service level indicator shows a degradation of the service? This situation usually means some part of Keycloak does not perform well. However, from the indicator itself, it is hard to say what part of Keycloak it is.
To identify the culprit of the problem, we provide the Troubleshooting using metrics guide that lists chosen metrics. Using these metrics, you can visualize what is happening in your deployment and down problems.
Some examples of metrics from the guide are listed below:
-
Number of operations performed by Keycloak like password hashes, login flows, token refreshes, etc.
-
Memory usage
-
Database connection pool utilization
-
Number of HTTP requests per URL and outcome
-
Hit ratios for internal caches
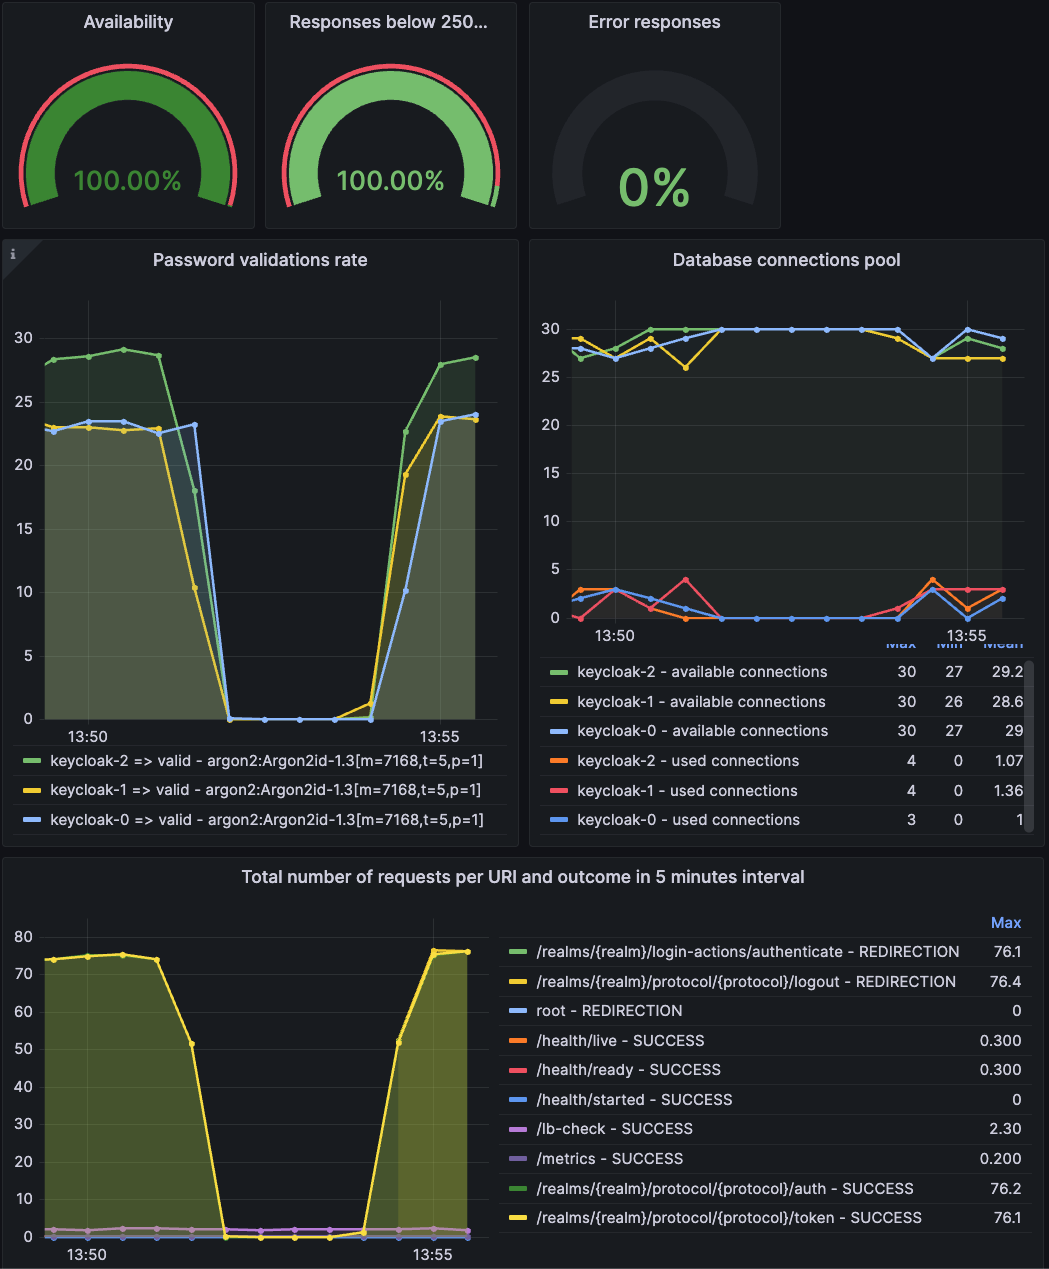
For environments with Prometheus for collecting metrics and Grafana for displaying them, we also provide Grafana dashboards to make troubleshooting smoother. Find instructions on how to deploy our dashboards into your Grafana instance in the Visualizing activities in dashboards guide.
Grafana dashboards with SLIs (click to enlarge)
My Keycloak is still sick :( I need an in-depth examination
Thanks to metrics, you can observe certain aspects of the system and how they evolve over time. However, they may not provide a detailed picture of what is happening inside Keycloak for a specific request. For this, you can leverage traces. Learn more in the Root cause analysis with tracing guide.
With tracing, you can observe steps that Keycloak was performing for a specific request, including the respective timing for each of them. These steps include operations by Keycloak but also waiting time for responses from third party services like the database, LDAP, Infinispan and others. This helps you to reveal where the bottleneck in your system is.
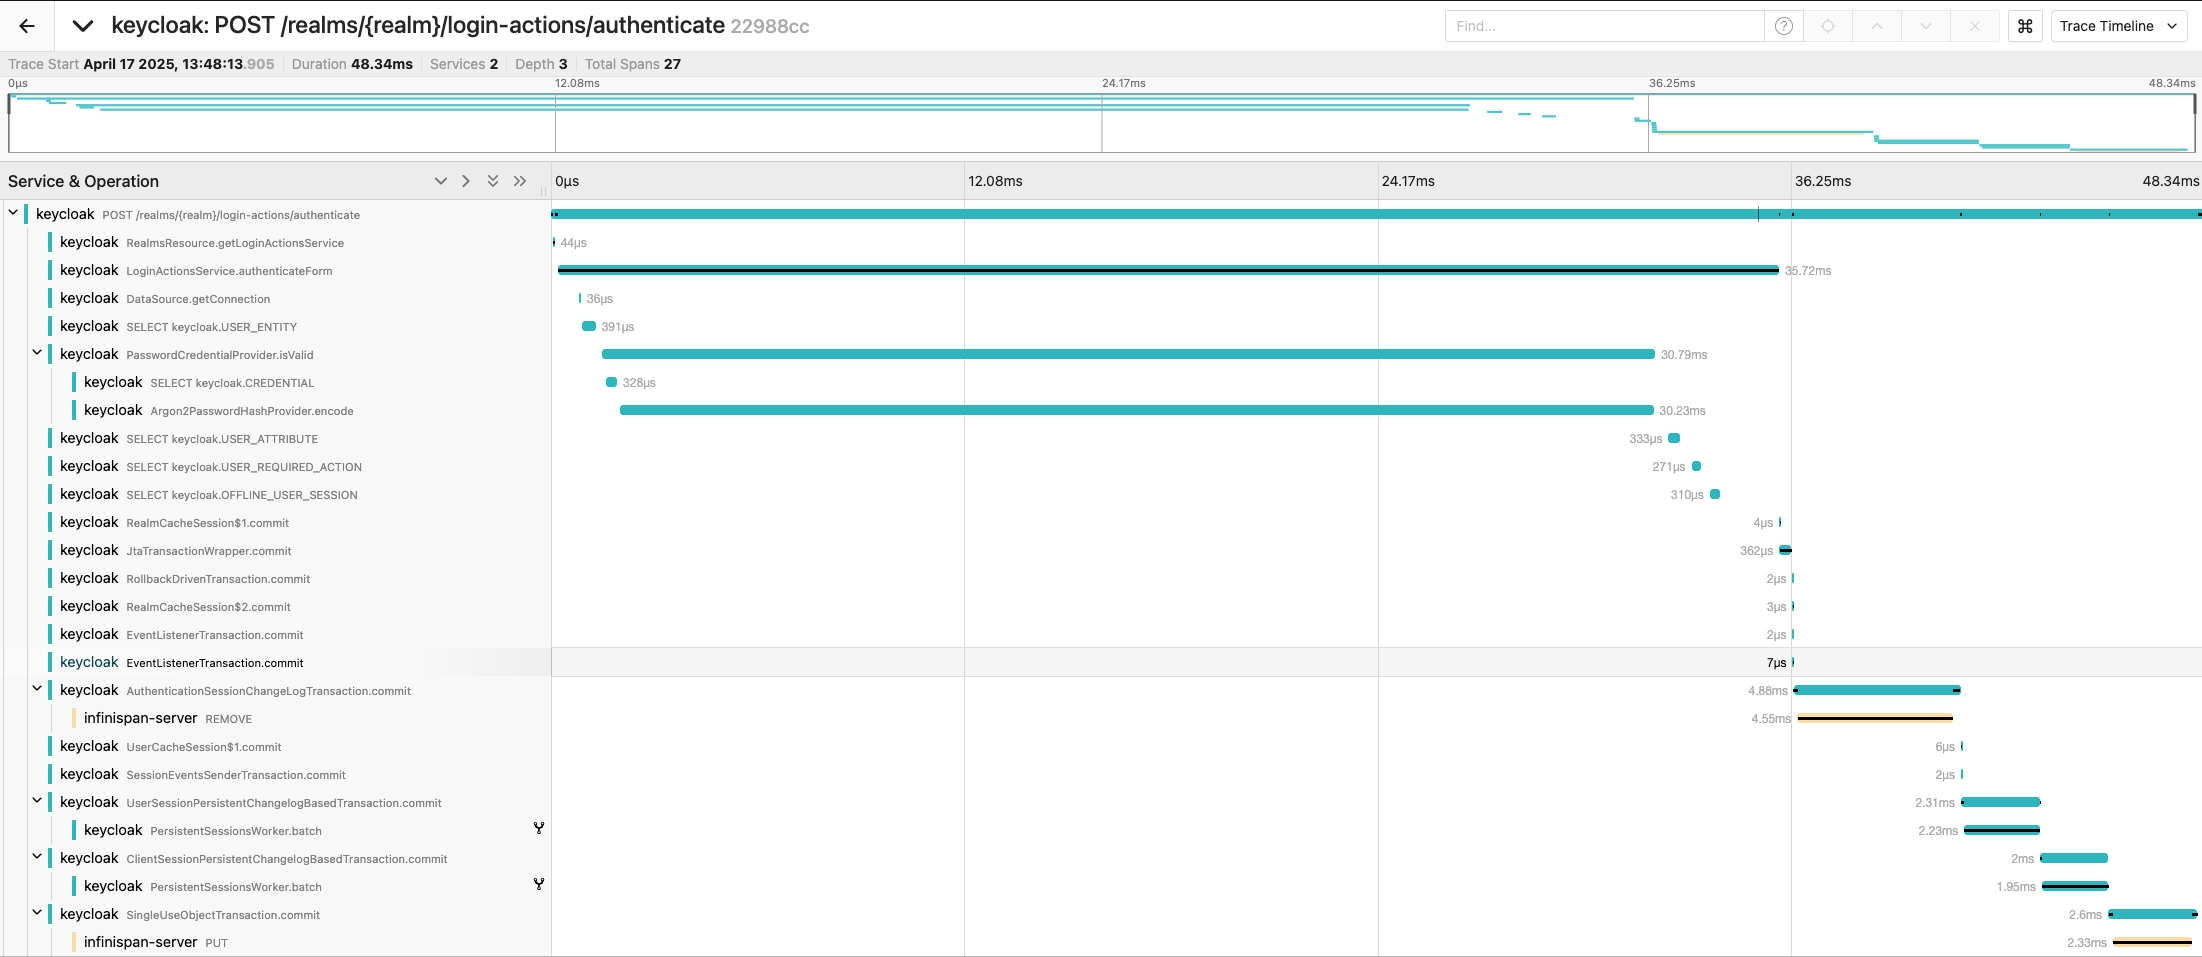
In the example below, you can see steps Keycloak was performing when a user submitted the username and password form. You can see the most time-consuming step was password hashing, which took 30 milliseconds out of 48-millisecond total request processing time.
Trace displayed in Jaeger (click to enlarge)
Next steps
To see all of this in action and to ask live questions, join the Keycloak hour of code online meetup held on 7th May 2025 at 4pm CEST dedicated to observability.
As an appetizer, see a shorter version of a demo by Ryan Emerson recorded at KubeCon London 2025.
To ask questions outside the meetup, use the CNCF #keycloak-sre-sig Slack channel. Use https://slack.cncf.io/ to join the CNCF Slack if you do not have an account yet.
You can also leave the feedback in the Keycloak GitHub discussion dedicated to this blog post.